
New Features
General
- Satellite view in map
The user can choose to display sensors on a Google satellite map view in all maps.
- New and improved grid across the application
A new and improved grid was introduced across the Axonize application. The new grid allows the user to arrange the columns by dragging as well as resizing of the column widths.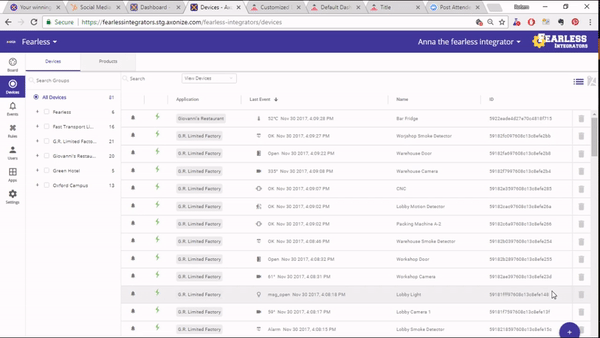
- Heatmap chart type
A heatmap chart type is added to all charts in the application – widgets and device panel. The heatmap presents the selected reading over the chosen time period in a color code. This allows the user to quickly identify trends and patterns.
Dashboard
- Customized color ranges in the gauge widgets
The user can set the ranges the colors of the ranges that will be shown in the different gauge widgets.
- Send command to a web service
An action to send a command to a web service was added in the rules engine. The user can configure a rule to send a command to a web service when a rule is triggered.
- User name & Role in the Audit Table
The Audit grid shows the user name and position of any person using the application, in addition to other user’s details shown in the past as: date, email, action, etc. The grid is both searchable and can be sorted.
Bugs Fixed:
- Browser notifications stop when a user is logged out
When a user is logged out of the Axonize application, the browser notifications stop.
- Group search in device panel is not case sensitive
The group search option in the device panel is not case sensitive.
- Export to PDF / CSV in Hebrew
Export of device readings and chart data to PDF or CSV in Hebrew is now possible.