
New Features
Chart Improvements
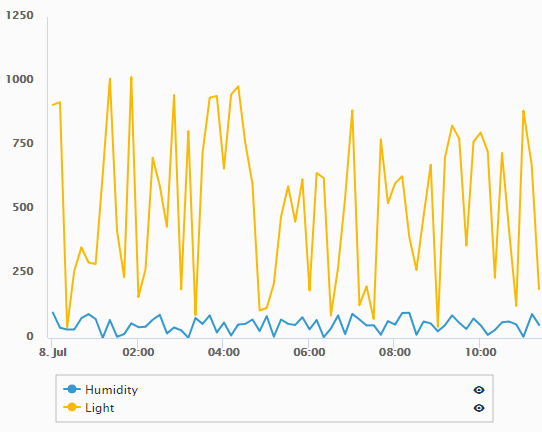
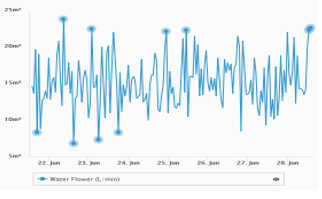
This Release includes our new charts design which was modified in order to support a clearer presentation of several readings series over a Cartesian axis system. The charts include 3 different display options:
- Shared - Readings share the same Y-axis. The share option is best for scale differences visualizations.
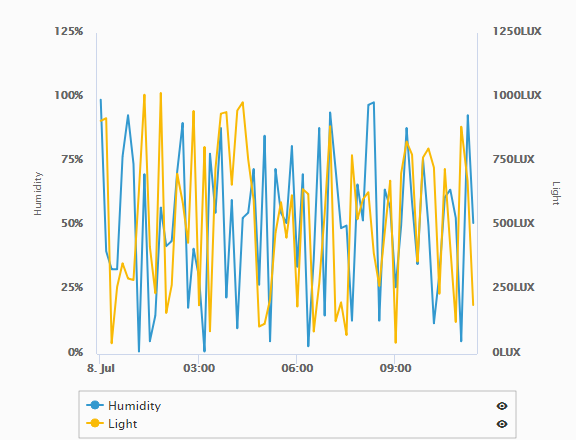
- Unstacked - Readings are normalized and each of the readings is displayed with a different Y-axis. The unstacked option provides comfortable visualization of correlation and trends between readings of different scale.
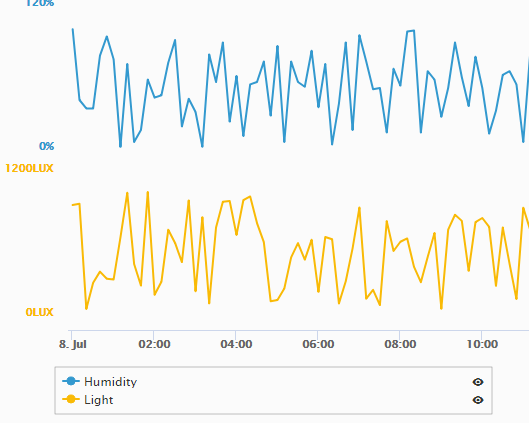
- Stacked - Readings are stacked on each other, each reading with its own Y-axis.
The default display option will be unstacked.
Charts Machine Learning
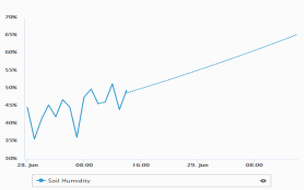
The new Axonize Machine Learning feature allows a better understanding of device reading by using AI. The new feature includes 2 functions:
- Reading trends - Predict readings trend by using 2 different algorithms - Linear and Quadratic
- Anomaly Detection - highlights readings deviating from the norm.
The Machine learning feature is available as part of the Axonize analytics package.
Fixed Bugs
- Disabled filter button - The 'OK' button was disabled in some use cases
- Delete button location - In specific views, the trashcan icon was moved from his original position
- Connection status alignment - Filtering device by there connection status resulted in wrong results.
- User Phone number validation -The system added the wrong country code in specific cases.
- Time discrepancies when exporting device chart data - Hours of the charts and the matching exported file were not aligned
- User data editing - The data in the user's tab was not editable